
Transform the way you use and visualize data so you can bring your best ideas to life. With dozens of ready-to-use templates and thousands of customizable shapes, Visio makes it easy—and fun—to create powerful visuals.
Visual collaboration for teams everywhere
Visio in Microsoft 365 is available to Microsoft 365 commercial subscribers, so you can create professional diagrams anytime, anywhere, with anyone.
The ultimate tool for diagramming
Create easy-to-understand visuals with confidence. Choose from dozens of premade templates, starter diagrams, and stencils available in the Visio desktop and web app.

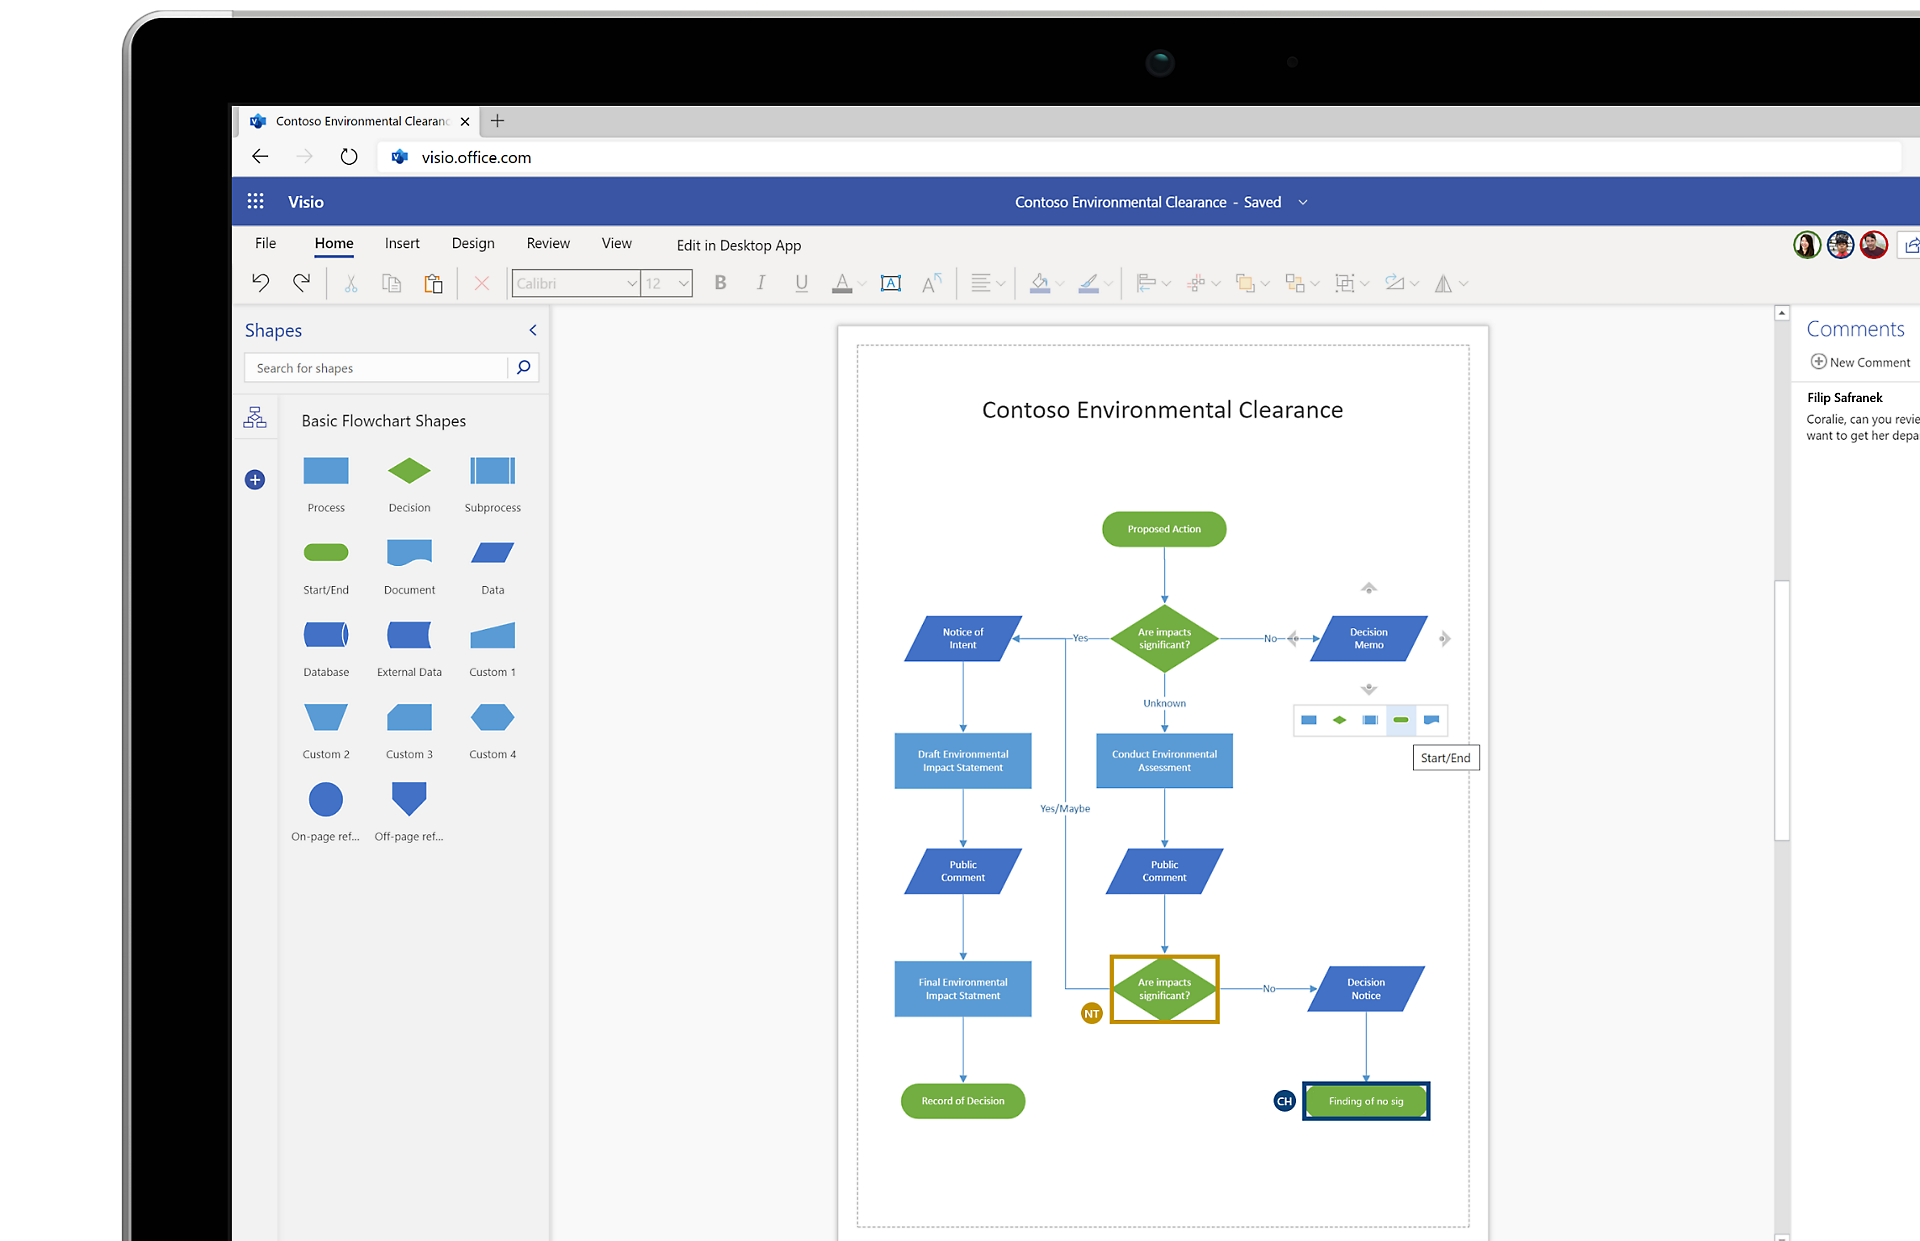
Flowcharts
Bring your ideas to life with Visio’s powerful flowchart features. Use the vast library of shapes, stencils, and templates to turn numbers and information into impactful stories.

Org charts
Easily craft org charts to visualize team, hierarchy, or reporting structures, and then share them with employees, teams, and stakeholders.

Floor plans
Design a social distancing workspace, retail store layout, new home, and more with accurate, scalable templates and tools to help you visualize function, flow, and aesthetic appeal.

Brainstorming
Think out loud. Make brainstorming simple and actionable with a range of templates for visualizing problems and mapping solutions—from fishbone diagrams to SWOT analysis.

Network diagrams
Simplify your system design process and illustrate how devices and networks all work together with a variety of network templates, shapes, and connector tools.

Collaborate in real time
Create and coauthor professional-looking diagrams for effective decision making, data visualization, and process execution to help increase productivity across the business.
Visio and Microsoft 365
Visio is an innovative solution that helps you visualize data-connected business process flows with a host of integrated features that bring the power of Microsoft 365 to Visio.

Create, view, edit, and collaborate on Visio diagrams from inside Microsoft Teams.

Use Visio Visual to embed Visio diagrams into Power BI dashboards.

Export Visio diagrams to Power Automate to automatically execute business workflows.

Convert Excel process map data into Visio diagrams from within Excel with Data Visualizer.

Break down complex diagrams into single parts with PowerPoint slide snippets.

Quickly document your Visio process diagrams, including all their metadata, in Word.

Store and share Visio files with 2 GB of free OneDrive storage—included with both Visio for the web plans.

Develop accurate network diagrams in Visio for the web with Azure-specific shapes.

More accessible than ever
Visio supports a variety of accessibility features—including Narrator, Accessibility Checker, and high-contrast support—to help ensure your Visio diagrams are available for everyone.
Enterprise-grade security and privacy
Visio shares many of the same security features as Microsoft 365 apps, including Information Rights Management (IRM), to provide persistent production of diagram files while users collaborate.
Determine which app best fits your needs
Discover the right solution to help you easily create professional diagrams and communicate your ideas visually.
Visio web app
Included with Visio Plan 1 and Visio Plan 2

-
Extend your Microsoft Visio experience to the browser, where you can view, create, and edit diagrams stored in the cloud.
-
Allow Microsoft 365 subscribers to view, print, and share diagrams and insert comments on the go.
-
Visio for the web is always up to date. You’ll never need to install a new version.
-
Built on the Microsoft cloud, Visio for the web inherits many of the same security, accessibility, and compliance features available in Microsoft 365 products.
Visio desktop app
Included with Visio Plan 2

-
Select from more than 250,000 shapes through Visio’s online content ecosystem.
-
Access additional templates not currently available in Visio for the web.
-
Work more naturally using your finger or pen to draw and annotate diagrams on a touch-enabled device.
-
Automatically generate org charts from data sources like Excel, Exchange, or Microsoft Entra ID.
Frequently asked questions
-
Trial versions only exist for Visio Plan 1 and Visio Plan 2. These trials are free for 30 days for first-time trial users with a work or school account. To sign up for your 30-day trial, visit the following links for Visio Plan 1 and Visio Plan 2. Visio Plan 1 provides access to Visio for the web. Visio Plan 2 provides access to both Visio for the web and Visio desktop. There are no trial versions of Visio Standard or Visio Professional.
-
Following is a complete list of the Microsoft 365 commercial plans that include the Visio web app: Microsoft 365 Business Basic, Microsoft 365 Business Standard, Microsoft 365 Business Premium, Microsoft 365 Apps for business, Office 365 E1, Office 365 E3, Office 365 E5, Office 365 F3, Microsoft 365 F3, Microsoft 365 E3, Microsoft 365 E5, Microsoft 365 Apps for enterprise, Office 365 A1, Office 365 A3, Office 365 A5, Microsoft 365 A1, Microsoft 365 A3, and Microsoft 365 A5, including versions of some of these suites that do not include Teams.
Please note, small and medium business plans—such as Business Basic and Business Standard with a Microsoft account ID (hotmail.com, outlook.com, live.com, msn.com)—will not have access to the Visio web app, as these plans do not qualify as commercial plans.
-
You cannot mix 32- and 64-bit versions of Microsoft solutions. To resolve this, you will need to uninstall your current 64-bit version of Office and install the 32-bit version instead. Please refer to this support page for further instructions.
-
Running different versions of Office and Visio depends on the installation technology used to install the products. For compatibility, the rule is:
- You cannot install two products together that have the same version but use different installation technologies.
- You cannot install two products of different versions together if both products use Click-to-Run as the installation technology and those products have overlapping Office applications.
Please refer to this support page for more compatibility details and this support page for volume licensing installation.
-
For a non-subscription version (Visio Standard or Visio Professional), use the same product key you used for your existing app to download Visio onto your new machine. Sign in with an existing Microsoft account and enter your product key at microsoft365.com/setup. Redeeming your key links your account with the Visio app. Once you’ve completed the aforementioned steps, follow these steps to download Visio. For more details about installing Visio, please visit this support page.
For Visio Plan 1 or Visio Plan 2, please visit this support page for installation instructions.
-
Both Visio Plan 1 and Visio Plan 2 come with 2 GB of storage on OneDrive for work or school. If you don't currently have a OneDrive for work or school subscription, you'll receive 2 GB of storage with your subscription plan. If you do have an existing OneDrive for work or school subscription, the 2 GB of storage included in a Visio for the web plan does not add to your existing storage capacity nor does it override your current OneDrive for work or school subscription.
-
All currently supported versions of Visio will run on Windows 11. This includes both Visio plans and the 2013, 2016, and 2019 non-subscription versions of Visio. Your old Visio files will not be compromised when you upgrade to a newer version of Visio; your files will work as expected in the new version. However, Visio automatically blocks opening any pre-2013 Visio file. To resolve this, please visit this support page.
-
Yes, the current version of Visio is compatible with older versions. Yes, you can open files created in the current version with an older version and vice versa. Please note, the current version (by default) saves drawings as a .vsdx file. Whereas the 2003 version saves them as a .vsd file, so you will need to save your drawing as a .vsd file to open it in an older version of Visio.
-
Current versions of Visio offer Information Rights Management (IRM) features. In non-subscription versions of Visio, go to File > Info > Protect Diagram > Restrict Access.
You can’t set IRM from within Visio for the web, but Visio for the web honors whatever access rights have been set for a file in the desktop Visio app once the file is stored online. For additional details on IRM in Visio, please visit this support page.
-
Data linking is only available through the Visio desktop app, but in Visio for the web, you can view data-linked diagrams.
- Visio currently supports multiple data sources, including:
- Microsoft Excel workbooks
- Microsoft Access databases
- Microsoft SharePoint Foundation lists
- Microsoft SQL Server databases
- Microsoft Exchange Server directories
- Microsoft Entra ID information
- Other OLEDB or ODBC data sources
Follow Microsoft 365